

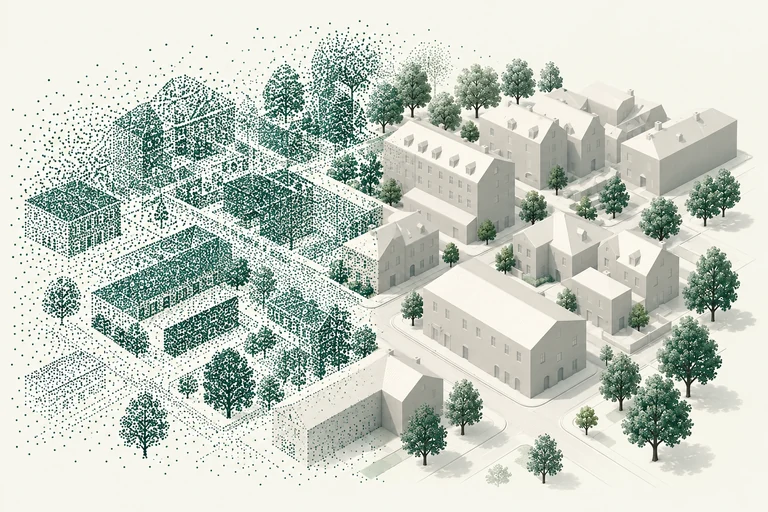
Reconstruct roof planes and building forms from high-resolution LiDAR scans.

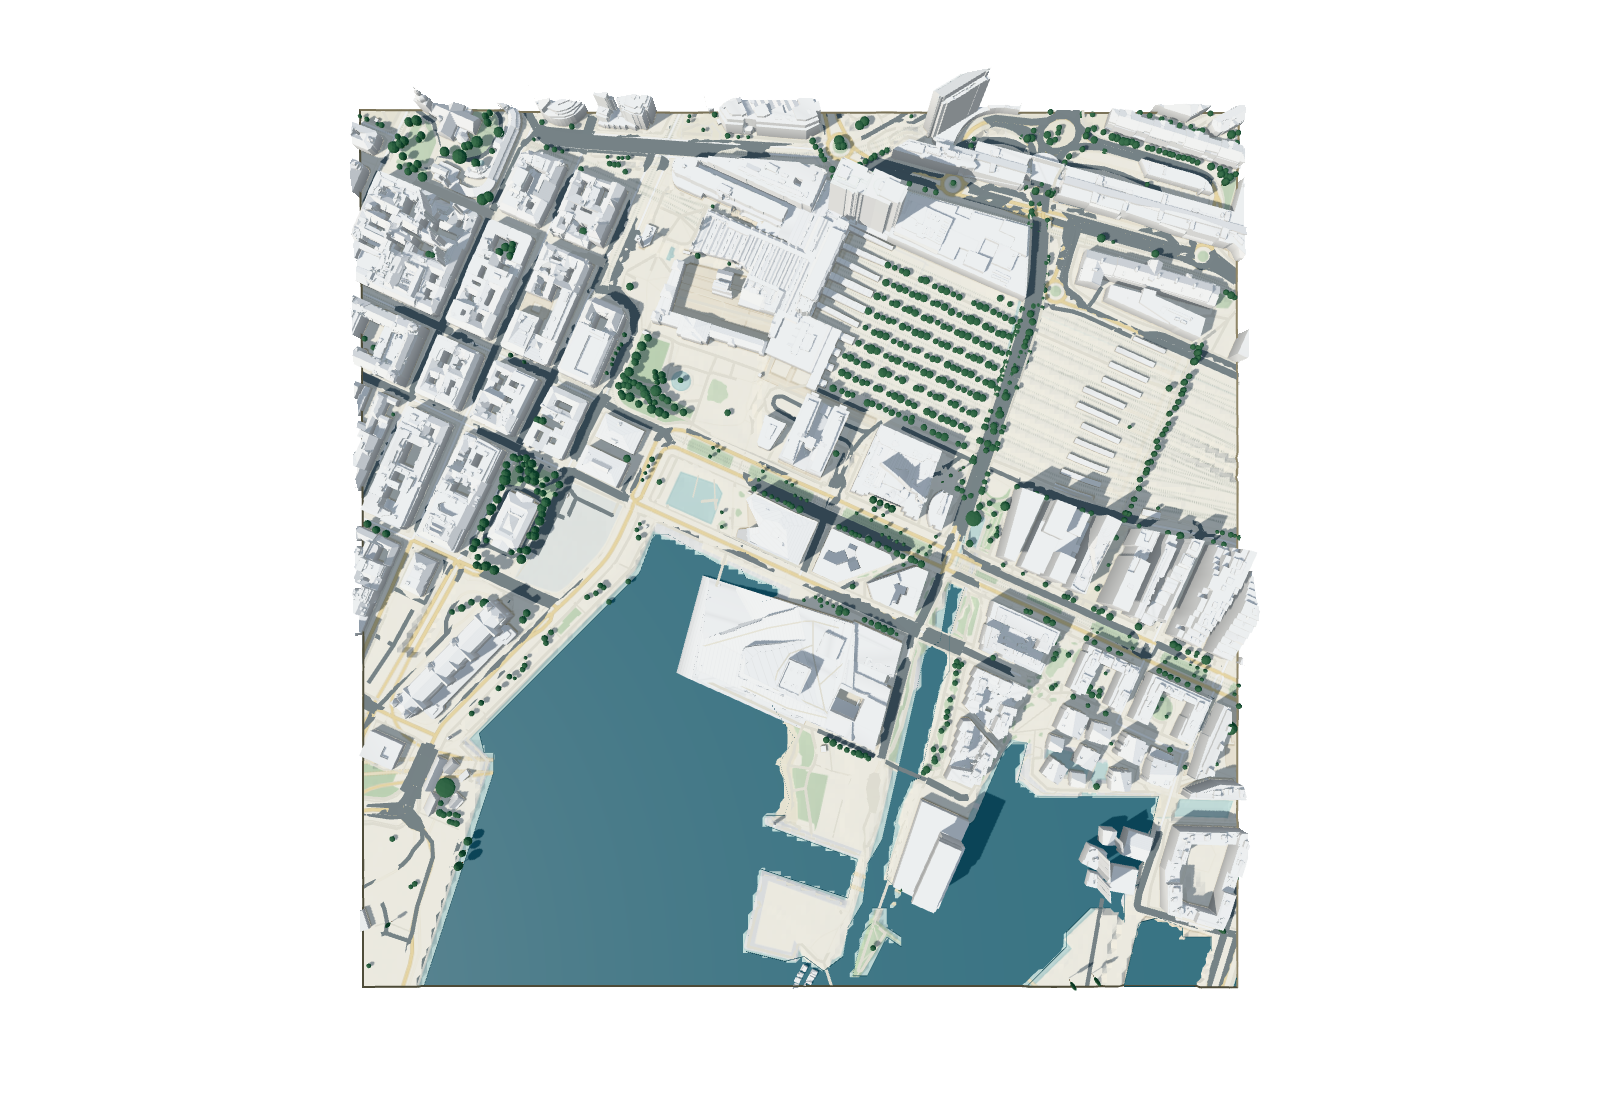
Create a 3D site model with terrain, buildings and map data for your chosen area. Import it into your BIM or CAD project.
Create your map


 + more
01 / The site map
Get a site map for your project area, organised into terrain, buildings, roads, water and vegetation layers. Explore the 3D model and switch on property boundaries below.
Find your project location and draw the area to include.
Select terrain, buildings and the other map layers your project needs.
Choose your file formats, then open the site map in your design software.
02 / Data quality
From LiDAR and national mapping to usable models and drawings.
Reconstruct roof planes and building forms from high-resolution LiDAR scans.
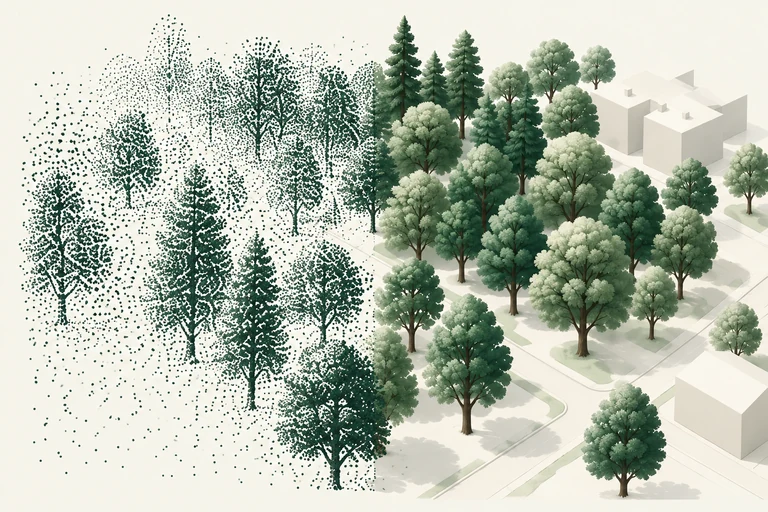
Estimate tree positions, heights and crown sizes from laser-derived surface data.
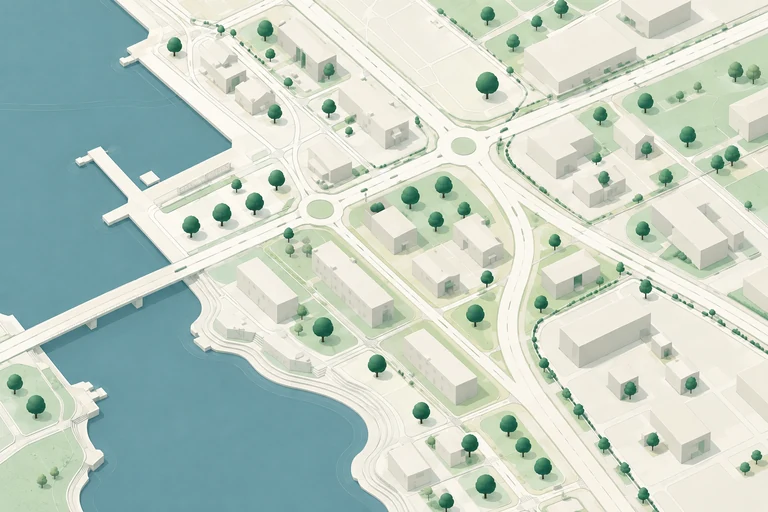
Combine national mapping with global datasets, choosing sources for each country and map layer.
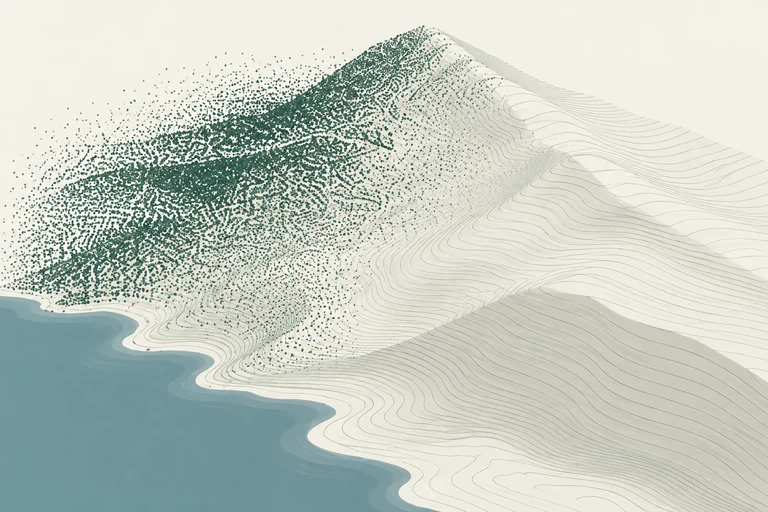
Use detailed elevation data to model slopes, ground levels and contour lines.
Add mapped boundary lines to your CAD drawings. Availability varies by location.
Use in your own projects and with project partners. Source licences and credits apply.
Lean geometry, controlled precision and useful file metadata — with smaller files and faster exports as the goal.
03 / Software & exports
Import directly with a plugin, or download the file formats your project needs.
Select your area, choose your layers and import your site model.
ArchicadBetaRevitComingVectorworksComingCivil 3DComingRhinoComingSketchUpComingChoose files for modelling, visualisation and GIS.
IFC DXF
DXF LandXMLRVTComingVWXComing3DMComingSKPComing
 OBJ
OBJ GLB
GLB COLLADAComing
 STL
STL PLY
PLY GeoPackage
 GeoTIFF
 GeoJSON
 XYZ
XYZ KMZ
KMZ Map image
And other applications that support these file formats.
04 / Country coverage
Explore the data behind your site model.
Sources and detail depend on your project location.
Loading source information…
NN2000
EPSG 5941
Country explorer could not load.
05 / Georeferencing
Keep the original map coordinates or work near a local zero point. Your model retains its geographic reference with any origin. Choose metres, millimetres or feet to match your project.
In the units you work with.Metres · Millimetres · Feet
06 / Pricing
Buy a site map for one project, or choose a monthly plan with an area allowance for ongoing work.
Site map
For a single project.
—/ km²
Minimum billable area: 1 km²
Professional
For your own design practice.
—/ month
20 km² each month · 1 person
Small Business
For a studio working together.
—/ month
50 km² each month · Up to 3 people
Extra maps are purchased separately.
Need more? Business: —/month · 200 km² · No seat limit.
| Included | Single site map | Professional | Small Business | Business |
|---|---|---|---|---|
| Price | —/ km² | —/ month | —/ month | —/ month |
| Billing | One purchase | Monthly | Monthly | Monthly |
| Map allowance | Your chosen area | 20 km² | 50 km² | 200 km² |
| People | — | 1 | Up to 3 | No seat limit |
Single site map: one purchase, minimum 1 km². Monthly plans include a map allowance shared by the people on the account.
07 / FAQ
The selected geometry, drawings or GIS files, organised by layer. The delivery also records its sources, attribution and coordinate reference information.
Detail follows the available source data. Building geometry, vegetation and terrain resolution can vary between areas. Review the source information for your site when you choose the delivery.
Use a GeoAnvil plugin in your BIM or CAD software, or export files such as IFC, DXF, OBJ, GLB and GeoPackage. The format directory above shows options for CAD, 3D visualisation and GIS.
Yes. Draw the boundary around your project and its surroundings. You choose how much context to include; the price and delivery are based on that area.
Sources and coordinate references are recorded with the map delivery. Source attribution and any applicable reuse conditions accompany the files.
Yes. A local origin changes the coordinates you work with, while the site map retains its geographic reference. Choose a local, site or custom origin to suit your project.
Basemaps © OpenStreetMap contributors, ODbL. Rendered with MapLibre by GeoAnvil.
Model and drawing sources are recorded in the demo downloads.
Explore GeoAnvil data sourcesNational source examples: Norway — Kartverket, NVDB and NVE; Finland — National Land Survey; Denmark — Dataforsyningen and GeoDanmark. Availability depends on the area and map layer.


